Figure 3-2Sample Conditional Boxplot for WY Minimum Combined Storage of Lake Powell and Lake Mead
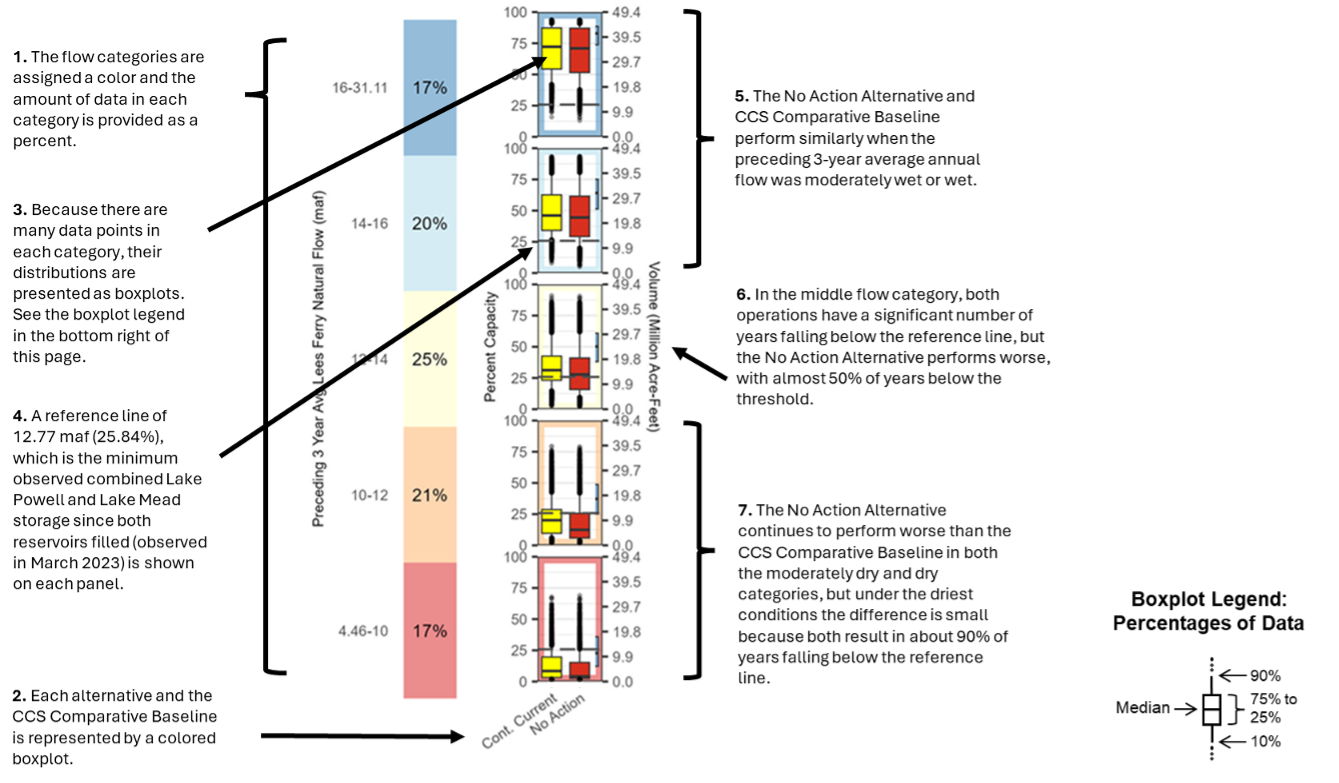
A sample conditional boxplot figure with annotations for guidance is provided in Figure 3-2, Sample Conditional Boxplot for WY Minimum Combined Storage of Lake Powell and Lake Mead. Figure 3-2 has numbered annotations to describe the features of the figure and provide an example summary of what the figure shows about the comparison between the No Action Alternative and the CCS Comparative Baseline. Reading the text in numerical order will provide the clearest understanding.
Conditional boxplots in the impacts analysis will show these two operations alongside the action alternatives. Additionally, reference lines representing values of interest (e.g., historical values or critical thresholds) will be shown with dashed lines. Conditional boxplots will be accompanied by tables of values captured in the boxplots to ensure that precise statistics are communicated.
The connection between system outcomes and hydrologic conditions is clear in the conditional boxplots because the data is sorted by preceding 3-year average hydrology. To determine which hydrologic categories to focus on, and which impacts to contemplate as reasonably foreseeable, the recently observed conditions presented in Figure 3-1 and Table 3-4 offer useful context. The most common category since 2000 is Average and the least common is Wet. There have been as many combined instances of Dry and Critically Dry conditions (seven) as there have been instances of Moderately Wet (though, notably, most of the Moderately Wet instances were close to being Average). Recent history combined with the increasing temperature trend, which is associated with lower streamflow, suggests that focusing more on the Average and Dry categories is warranted. However, Critically Dry conditions have been observed and could become more common.
Within each flow category, the distribution of data provides a connection to conditions that occurred before the 3 years used to sort the data into categories: the higher end of a distribution is likely the result of wetter conditions preceding the 3 years, and the lower end of a distribution is likely the result of drier conditions preceding the 3 years. Considering that 20 out of 24 years since 2000 have fallen in the Moderately Wet, Average, and Dry flow categories, it is prudent to focus on specific portions of the distribution within each flow category: the 25th to 75th percentiles (the colored portions of the boxes) are most relevant, since the high and low ends of the distributions are representative of extreme conditions occurring before the 3 years used to sort the data into the flow categories.