Figure 3-5Sample Vulnerability Bar Plot for WY Minimum Combined Storage of Lake Powell and Lake MeadConditions that could cause Combined Lake Powell and Lake Mead storage to fall below the historical minimum in more than 10 percent of years
Vulnerability bar plots provide complementary analysis to the robustness heatmaps by identifying the specific hydrologic conditions in which each alternative is likely to succeed or fail the preferred minimum performance level (recall, the preferred minimum performance is shown by the purple-outlined row of the heatmap). For example, the heatmap in Figure 3-3 shows that the CCS Comparative Baseline successfully meets the preferred minimum performance level in 29 percent of futures, meaning that the CCS Comparative Baseline is unsuccessful in the remainder of the futures (71 percent of futures). Vulnerability analysis uses information about both the successful and the unsuccessful futures to identify hydrologic conditions (via statistical characteristics) that are most skillful at predicting the different outcomes. Examples of the types of hydrologic statistical characteristics tested are:
- the driest 20-year average Lees Ferry flow over a 34-year hydrology trace
- the driest 10-year average Lees Ferry flow over a 34-year hydrology trace
- the median 10-year average Lees Ferry flow over a 34-year hydrology trace
The first two examples are the hydrologic characteristics generally found to be the most skillful predictors because they are highly correlated with the undesirable resource outcomes that occur due to dry hydrology. For information about other predictors and how they are tested, refer to Appendix E, DMDU Overview and Approach.
Once a skillful predictor is identified, the alternatives can be described in terms of the hydrology conditions associated with undesirable performance (i.e., the conditions in which an alternative is vulnerable). Alternatives will have different vulnerabilities because of their different approaches to operating the reservoirs. Conditions associated with vulnerability can then be compared to conditions that have occurred in the past and a range of conditions that could potentially occur in the future; if conditions that have already occurred are similar to those associated with vulnerability under an alternative, the conclusion is that the undesirable impacts are reasonably likely to occur in the future.
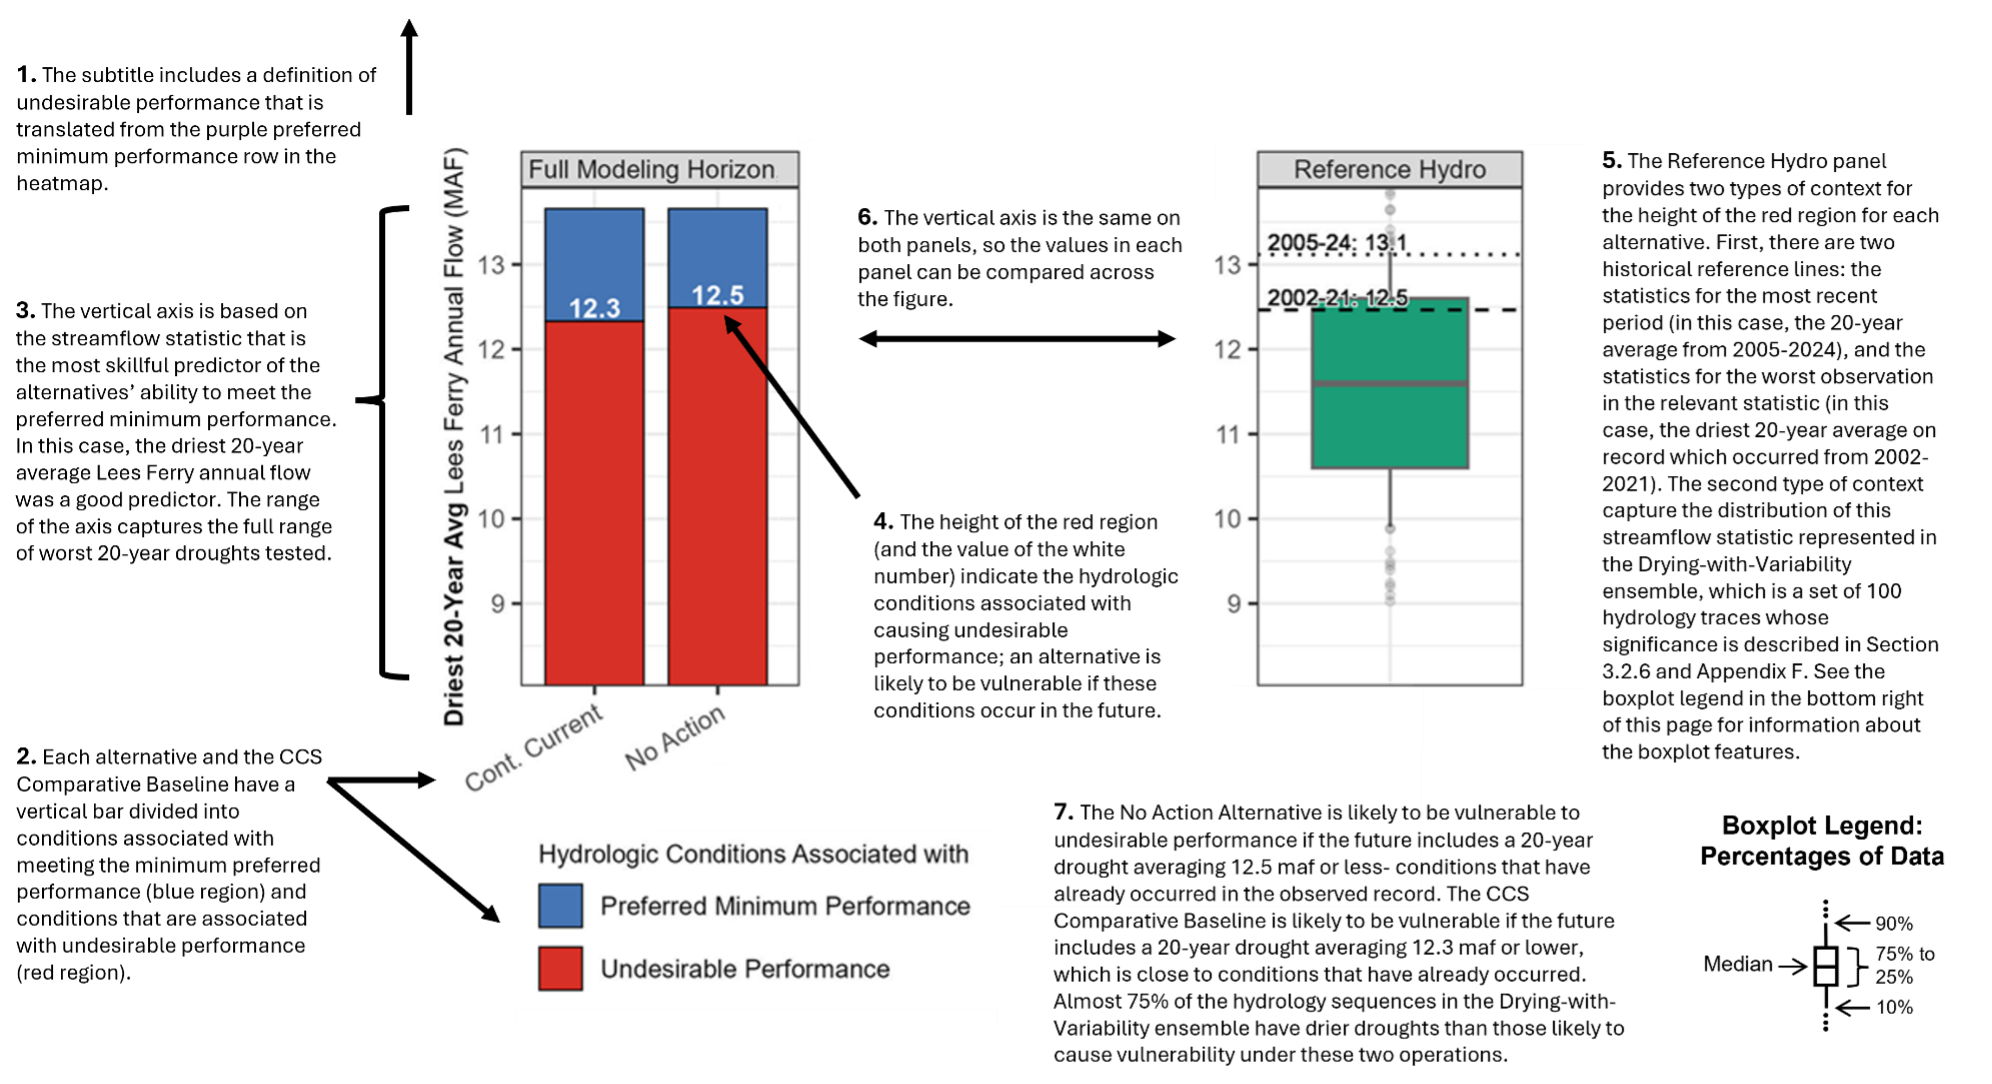
Figure 3-5 compares the vulnerability of the No Action Alternative and the CCS Comparative Baseline with respect to avoiding undesirable performance in combined Lake Powell and Lake Mead storage (i.e., falling below the historical minimum in more than 10 percent of years). The figure also shows how each alternative’s vulnerability compares to conditions that have occurred in the past or could potentially occur in the future. It is annotated using numbered descriptions as a guide to the features of the figure and a summary of findings. Reading the text in numerical order will provide the clearest understanding.
Vulnerability bar plots capture complex information, but even a brief visual inspection can provide the key conclusions about whether undesirable impacts could be reasonably expected under a given alternative.
Key visual tips to quickly interpret vulnerability bar plots: Every alternative is linked to a bar that is divided into blue and red; the larger the red portion, the wider the range of hydrology conditions in which the alternative is vulnerable. If the red portion of the bar encompasses, or is close to, conditions that have already occurred according to the reference hydrology panel, undesirable performance in that resource is likely to occur. (If a bar is completely blue, none of the conditions tested caused vulnerability and the alternative is robust.)
The “reference hydrology” panel introduced in Figure 3-5 is included in every vulnerability bar plot to provide context for interpreting the likelihood of the conditions associated with vulnerability. The historical reference lines are the first component of the context, and anytime an alternative is vulnerable to conditions that have already been observed it is reasonable to assume these conditions can occur again.
The second component of the context is the boxplot that shows projections about potential future conditions. These projections are based on the “Drying-with-Variability” ensemble, which is a 100-trace statistically generated ensemble that represents conditions that may occur in the future. Long-term planning in the Basin must consider the significant potential for a future with more frequent, sustained and/or severe dry periods and a downward trend in average flows, but this does not preclude the occurrence of wet years. The Drying-with-Variability ensemble was designed to capture this by combining information about the observed temperature trend, temperature’s impact on the translation of precipitation into streamflow, and the sequencing of wet and dry periods from paleo reconstructed data while preserving the potential for infrequent but significant wet years.